SERVICES

Data Analysis

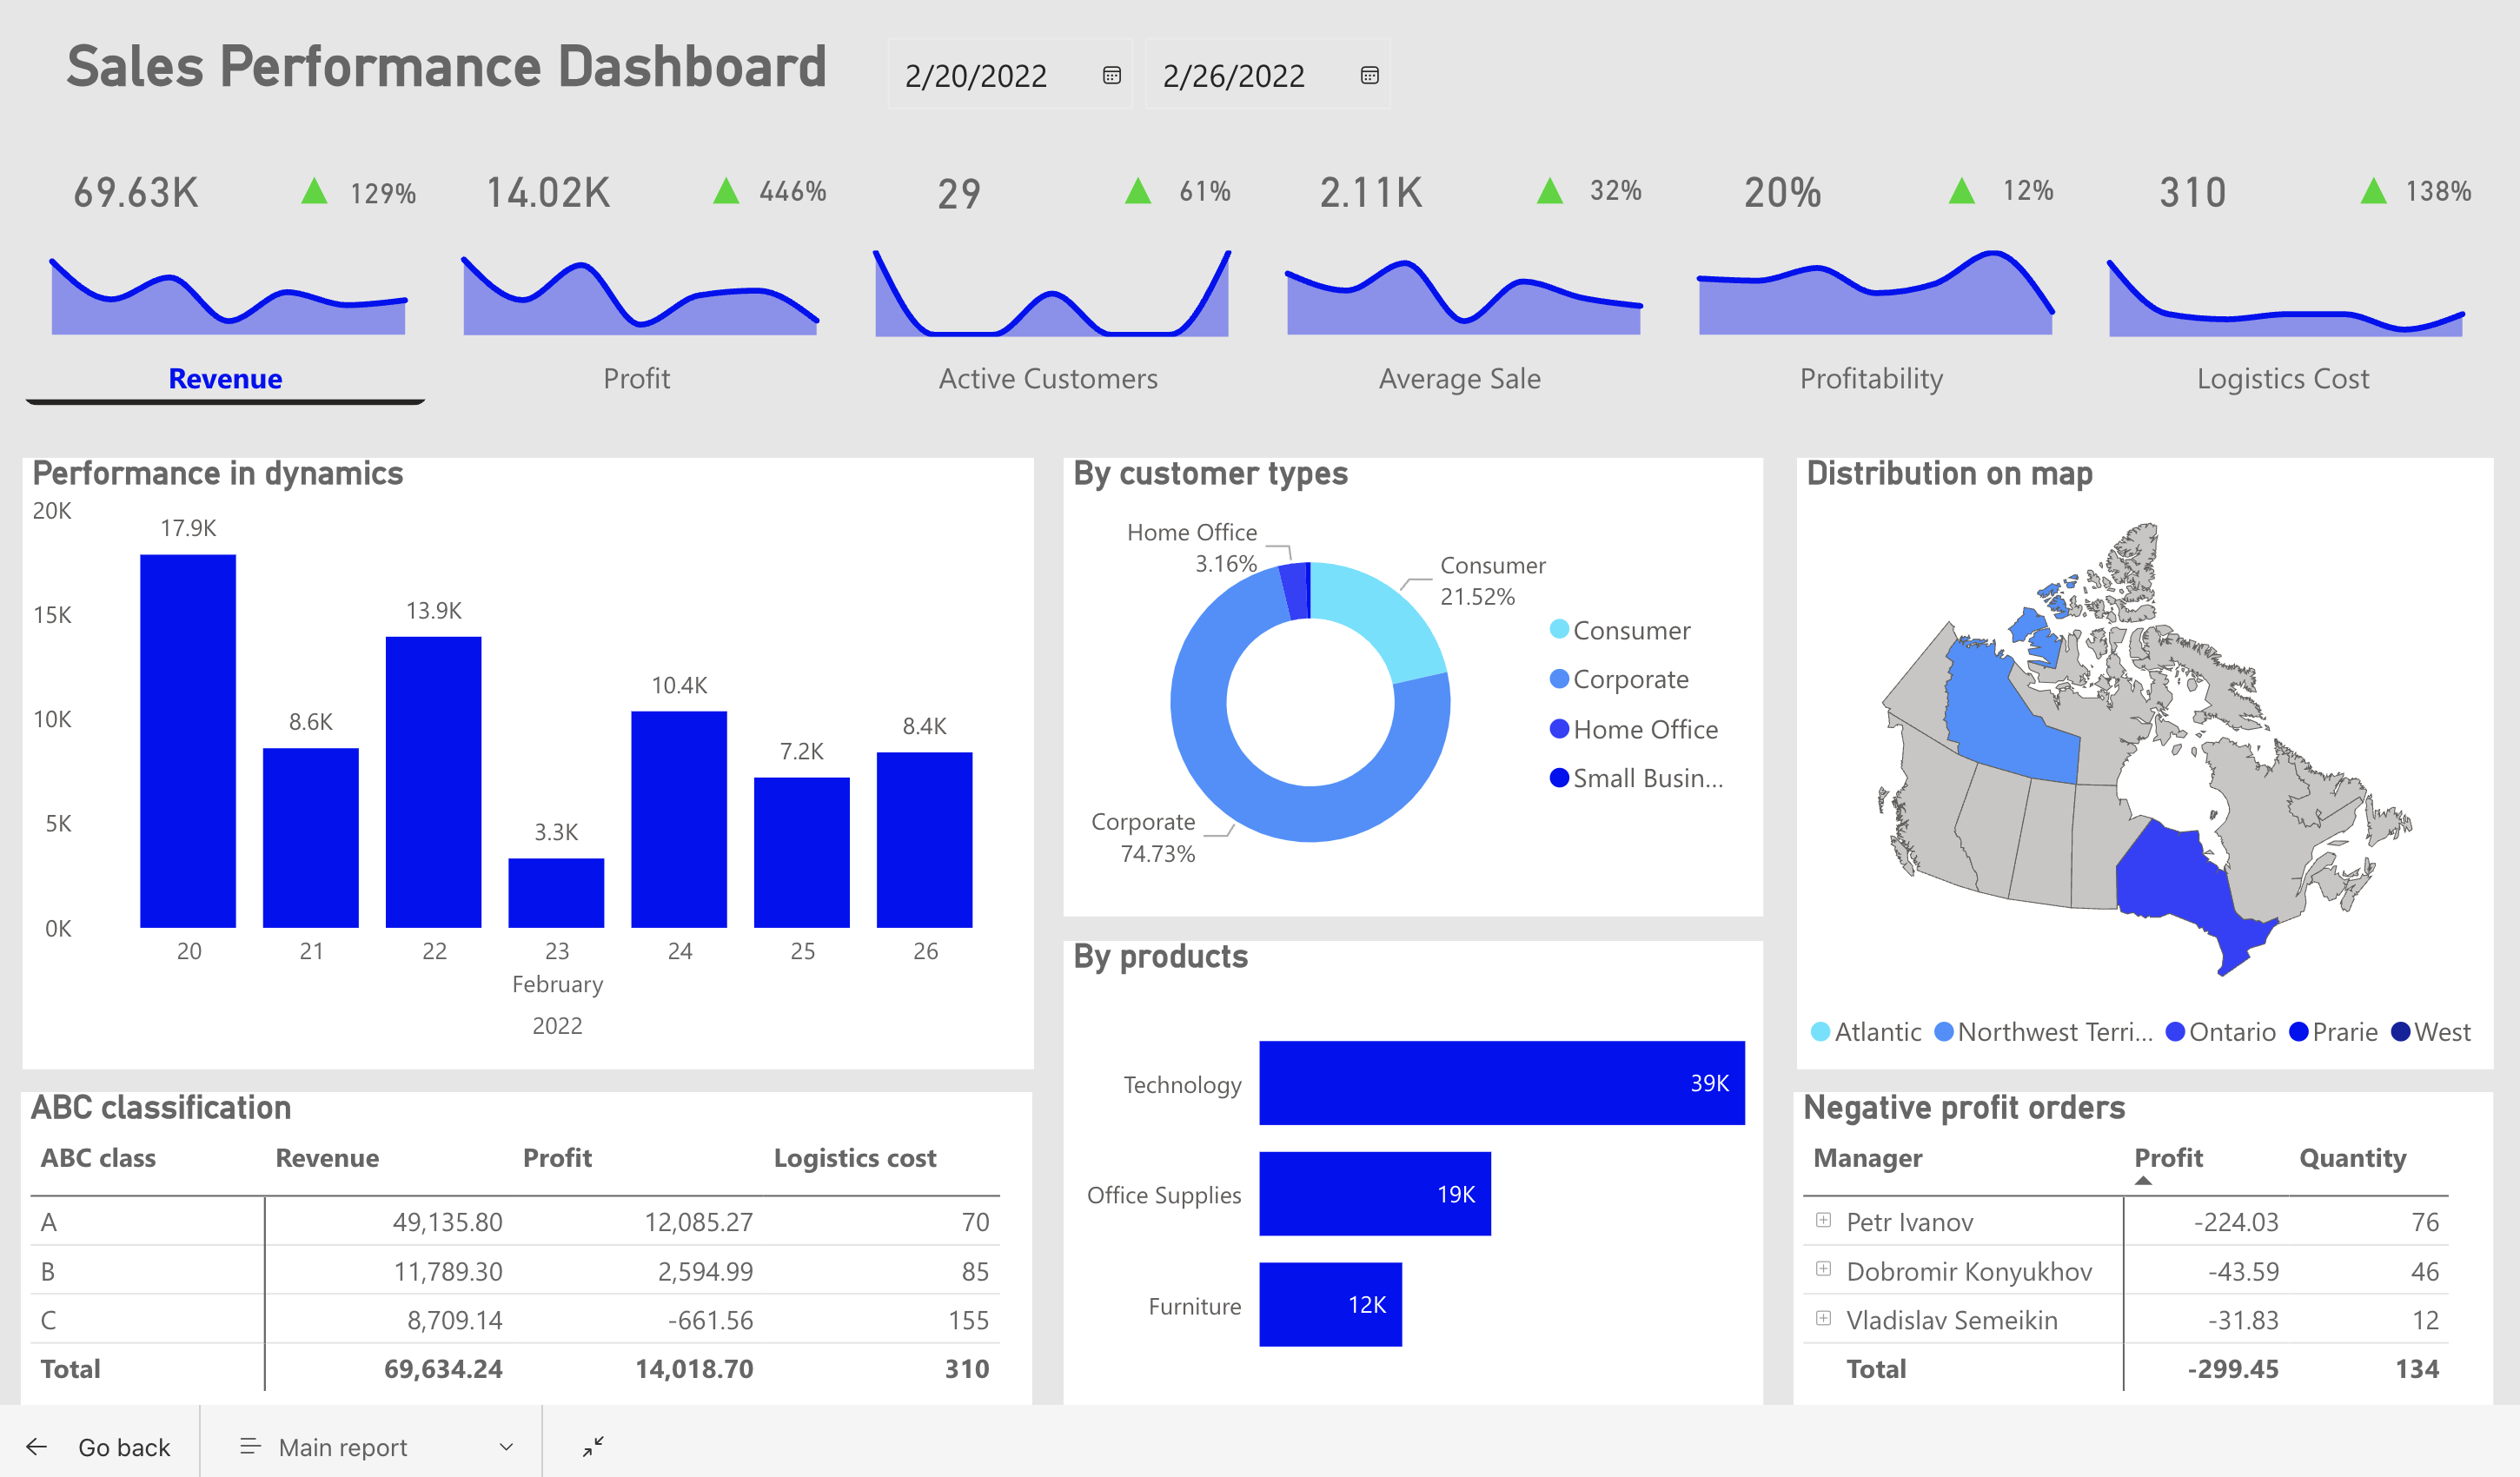
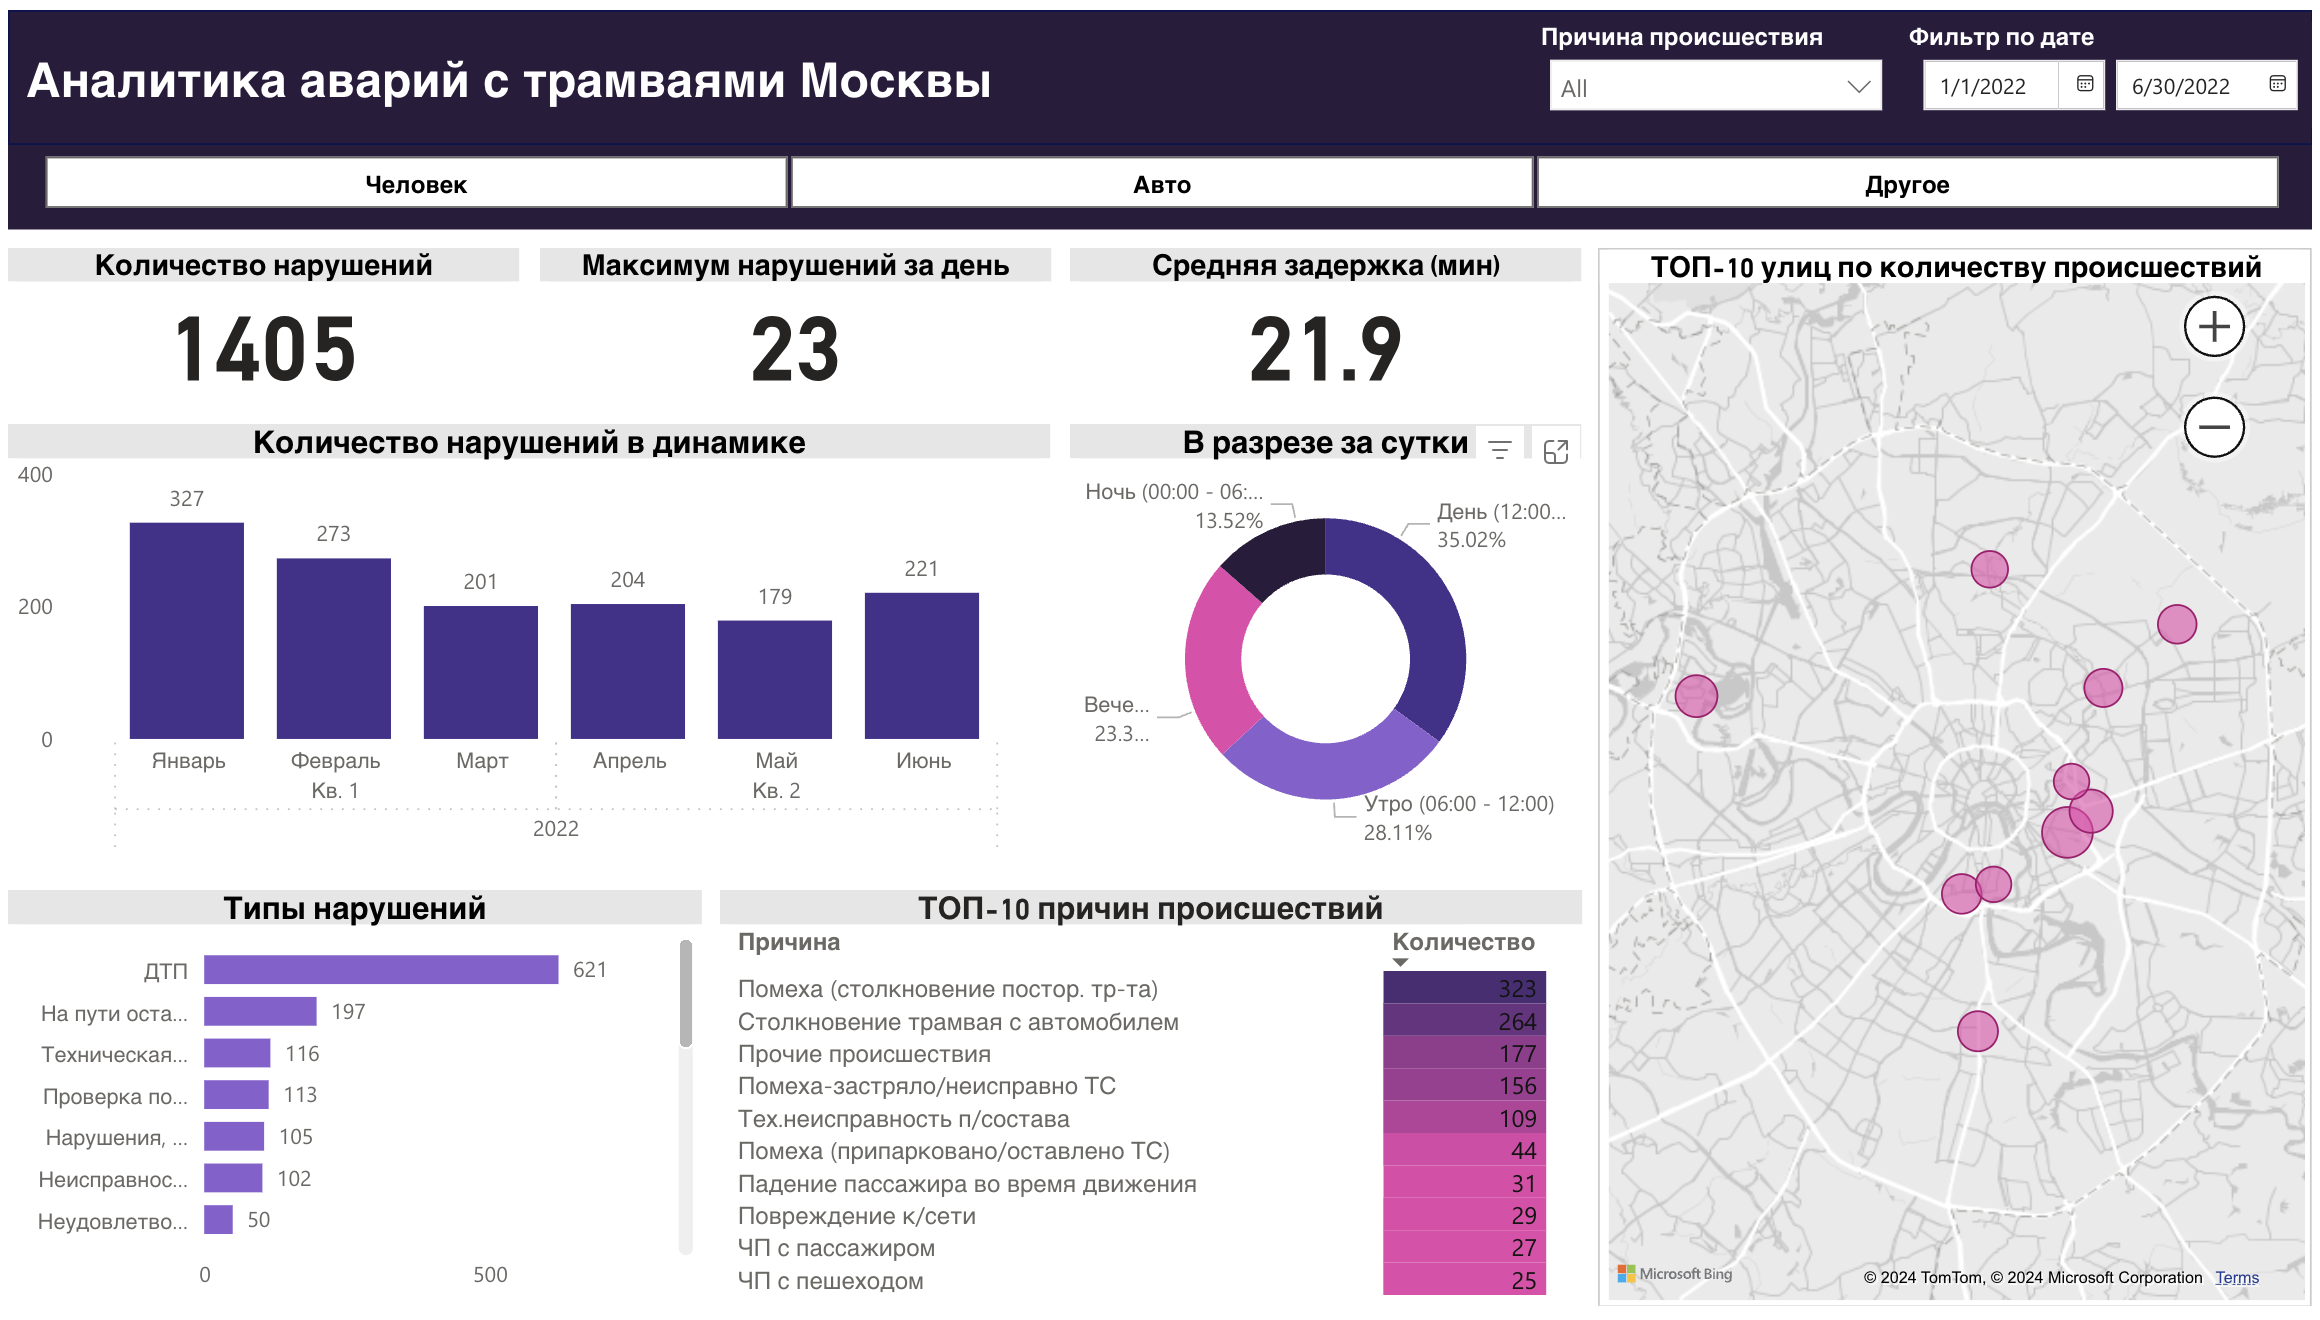
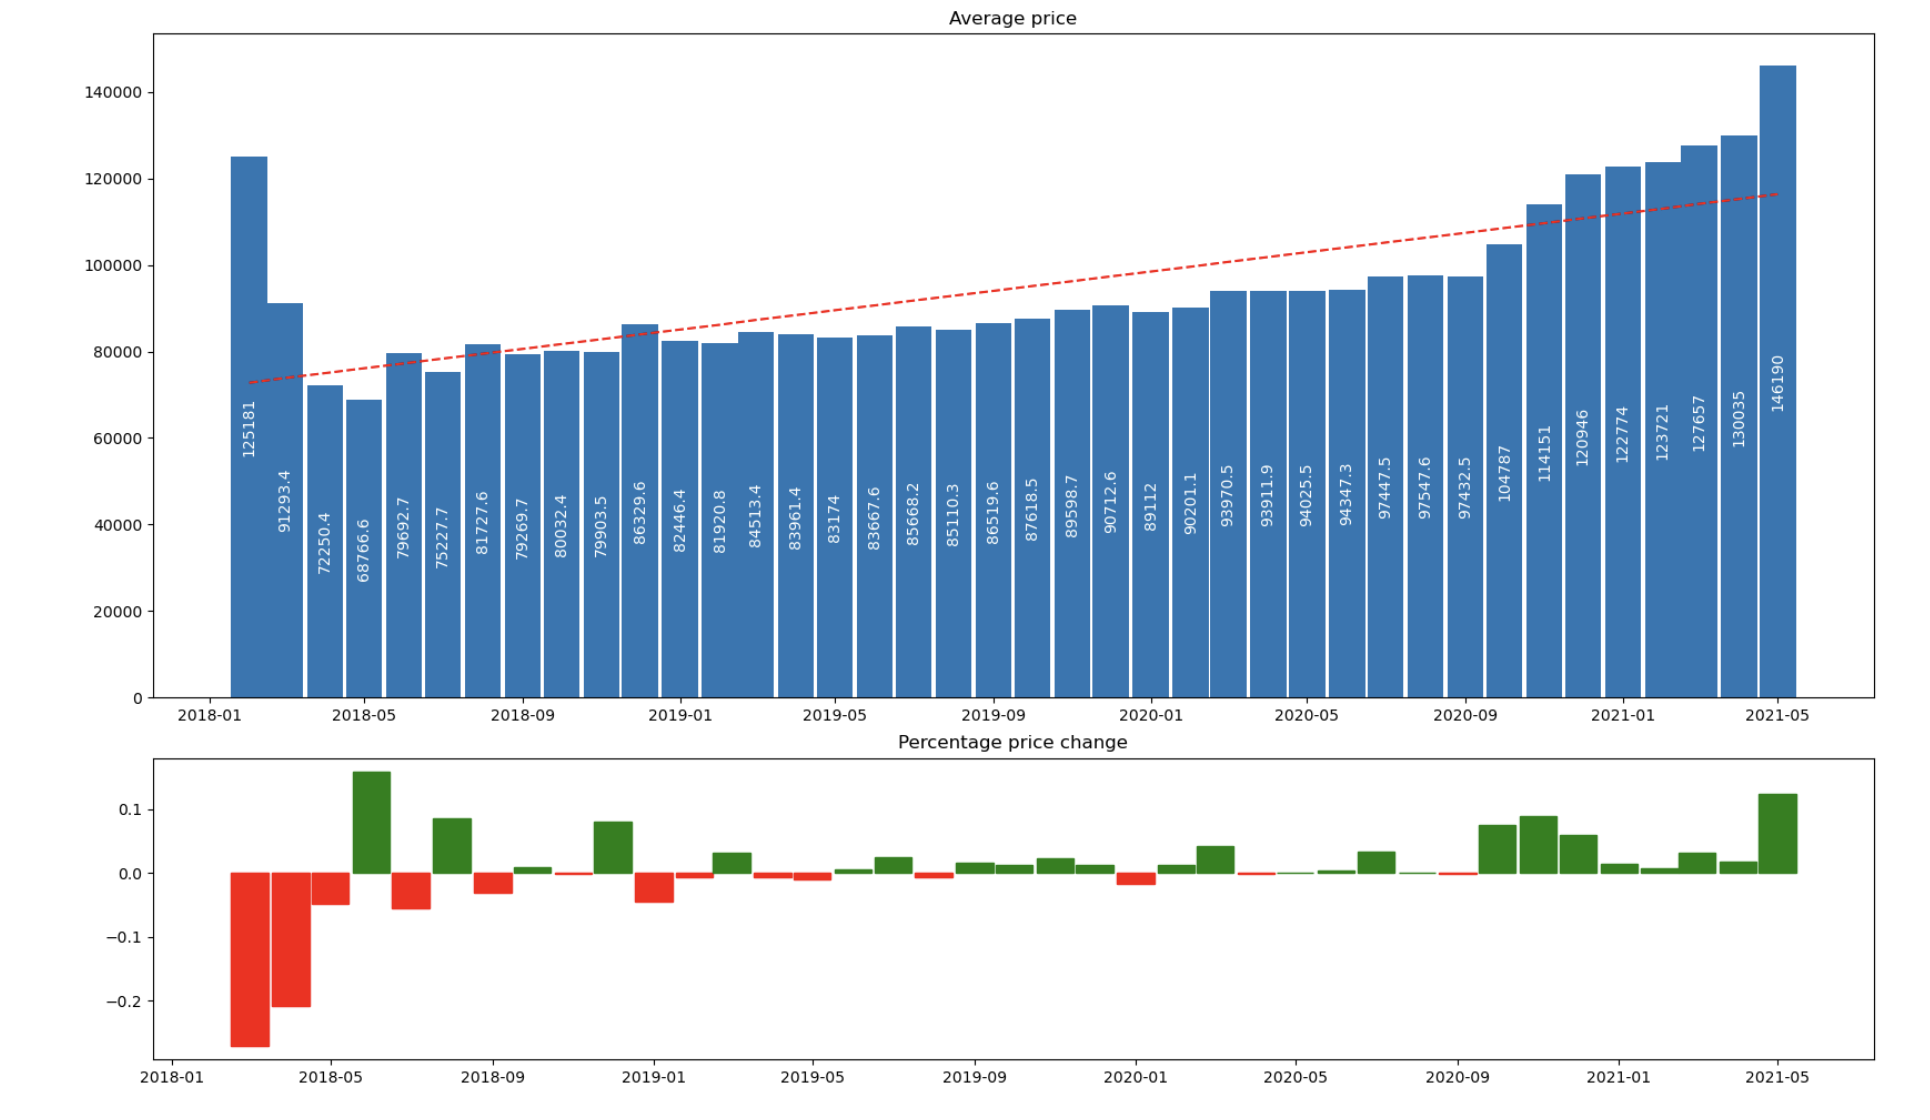
Performing in-depth data analysis, including trend analysis, forecasting, and segmentation, enabling stakeholders to gain valuable insights into business performance and trends. Using Python to perform data manipulation, analysis, and visualization.

Dashboards

Creating interactive reports, dashboards, and data visualizations using Power BI to transform complex data into actionable insights. Designing dashboards to visualize KPIs and track business metrics, facilitating data-driven decision-making.

Data Integration

Utilizing Power Query to integrate customer data from multiple sources, streamlining data processing and improving data accuracy. Connecting various data sources, perform data transformations, clean and reshape data for analysis.

Automated Reporting

Creating and editing macros VBA to automate repetitive tasks, such as data manipulation, report generation, and formatting. Developing Excel macros to automate regular reports, reducing report generation time and minimizing errors.

PORTFOLIO

Sales Performance Dashboard

Transformed raw sales data into actionable insights by developing an interactive and dynamic sales performance dashboard. Provided stakeholders with a comprehensive view of sales data.

Moscow Tram Accident Dashboard (ru)

This dashboard serves as a centralized hub for stakeholders to assess accident data, discern patterns, and implement targeted measures to enhance tram safety across Moscow.

Logistics Dashboard

Comprehensive visualization tool designed to provide real-time insights and analytics into various aspects of the supply chain and transportation operations.

Exploratory Data Analysis of Moscow Real Estate

Exploratory Data Analysis (EDA) serves as a foundational step in analyzing and understanding the intricacies of Russia's real estate market spanning the years 2018 to 2021.