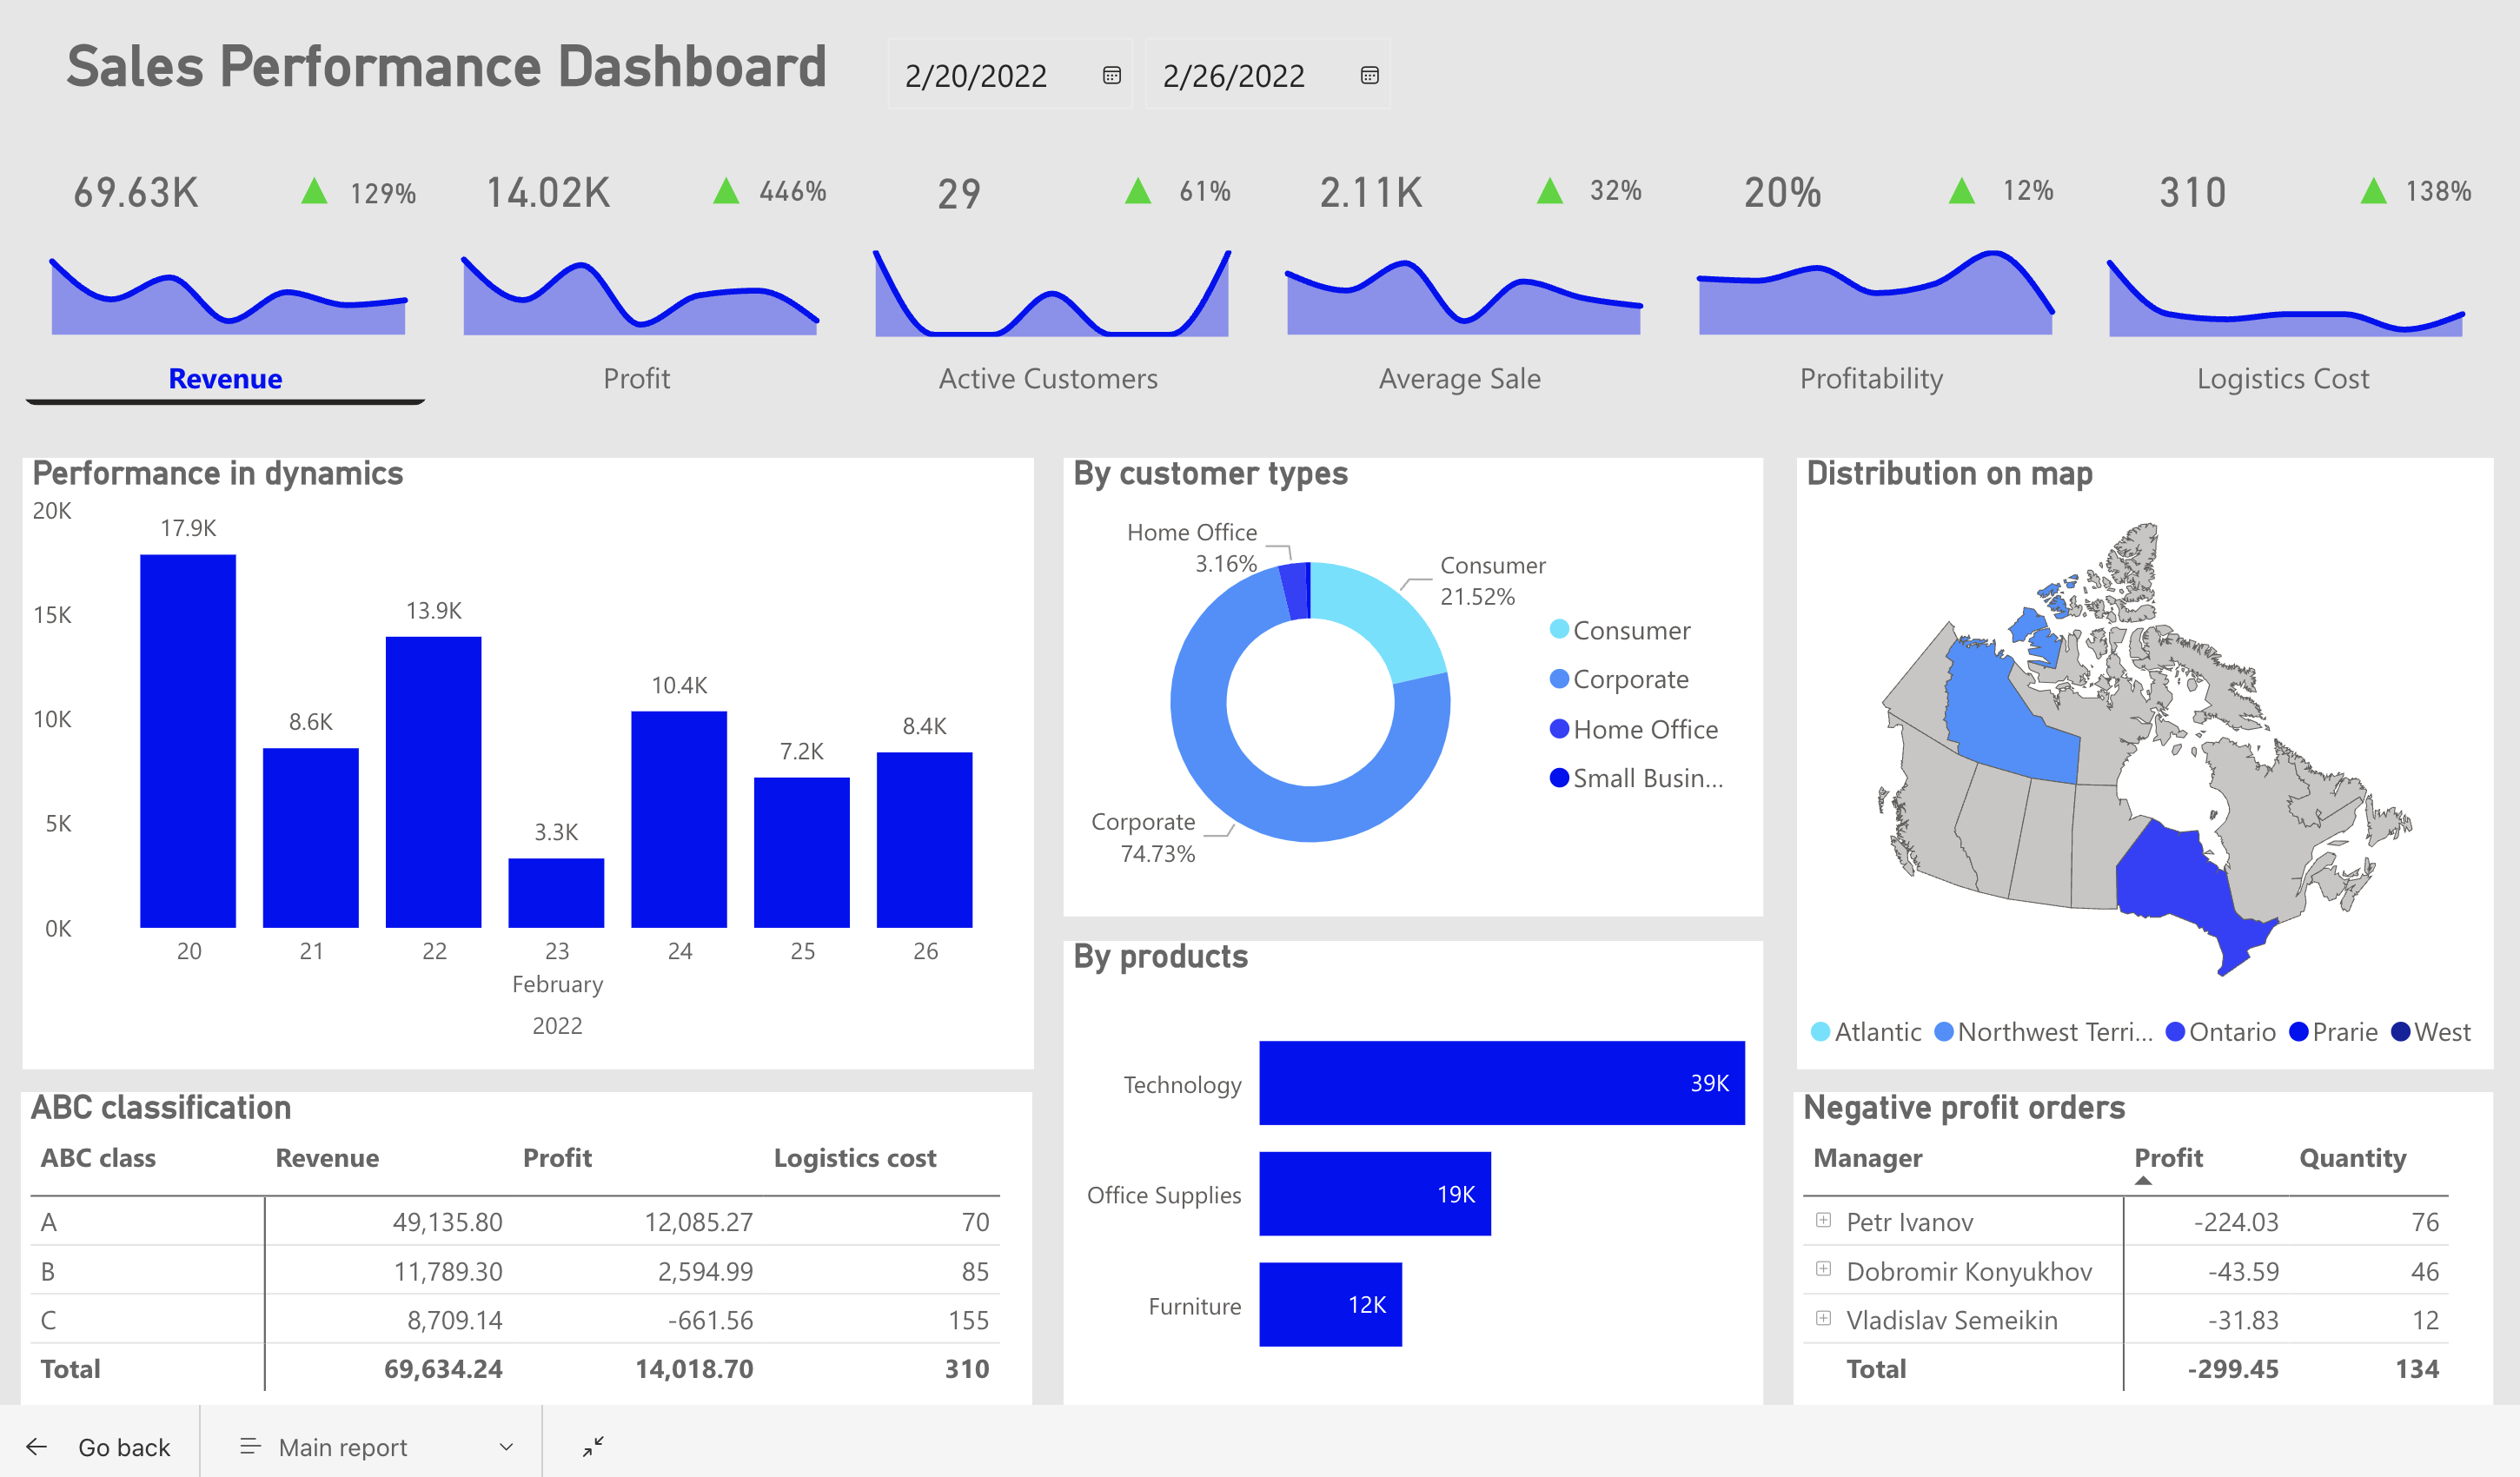
Sales Performance Dashboard

Transformed raw sales data into actionable insights by developing an interactive and dynamic sales performance dashboard using Power BI. This project aimed to provide stakeholders with a comprehensive view of sales metrics, enabling data-driven decision-making and strategic planning.
GOAL
Enhance decision-making and improve visibility. Empower stakeholders with a robust dashboard to make informed decisions based on real-time and historical sales data. Increase visibility into sales performance by developing a user-friendly interface that allows stakeholders to easily interpret and analyze key metrics.
KEY FEATURES
- Real-time Sales Metrics: Implemented real-time updating of critical sales metrics, ensuring stakeholders had access to the latest information for timely decision-making.
- Interactive Data Exploration: Developed an intuitive interface allowing users to interactively explore sales data, drill down into specific regions or product categories, and gain deeper insights.
- Visual Storytelling: Leveraged Power BI's visualization capabilities to create compelling charts and graphs, facilitating a visual storytelling approach that communicated complex sales trends with clarity.
- User-Friendly Design: Ensured a user-friendly design, making the dashboard accessible to stakeholders with varying levels of data literacy. Customized filters and slicers allowed for personalized data views.
RESULT
The implementation of the Power BI sales performance dashboard resulted in a streamlined decision-making process, improved sales strategies, and a notable increase in overall operational efficiency. Stakeholders gained a powerful tool to monitor performance, identify growth opportunities, and respond promptly to market changes.